About $36.8 billion a year in federal transportation money disappears Oct. 1. When funding gets tight, the questions about what got built get harder, and the projects with a clean record, from the model to the pour, will be the ones with answers.
The Wall Street Journal catalogued the shortcuts driving the data center boom. Here is what they mean if you are the one wiring the building.

A lot of money is going into building data centers faster. The Wall Street Journal on Sept. 1 catalogued six of the techniques doing it, with reported time savings running from a few hours to six months.

Bloomberg, using data from the market research firm Sightline Climate, reported that of roughly 12 gigawatts of U.S. data center capacity slated for 2026, only about a third was really under construction. The reasons cited: shortages of transformers, switchgear and batteries.

Plenty of people have strong opinions about the buildout. Set those aside. The work is being bid and built right now, and it asks something different of the trades than the work before it.

What are the six techniques speeding up data center construction?

Six unrelated products from six unrelated companies. Read them as a group and one strategy shows up. Speed is not coming from anyone working faster on site. It comes from decisions moved upstream, out of the field and into a shop or a spec.

Three land directly in electrical scope.

The drilling robot. DEWALT and August Robotics launched it this year reporting 99.97% accuracy across more than 90,000 holes. It drills anchors for server rack stops and the structural legs carrying overhead MEP. That robot sets the geometry your hangers land on.

The connectors. 3M’s expanded beam technology cuts plug-up from roughly three minutes per connector to as little as 30 seconds, across hundreds of thousands of them. Connection speed stops mattering if you connected the wrong thing quickly.

The factory-built rooms. The big one. Rooms get assembled in a plant, trucked in and set. Your coordination package is no longer a guide for a crew. It is an input to a production line.

Every shortcut there buys schedule certainty by giving up flexibility, and flexibility is what the field has always used to make imperfect drawings work. None of that hurts when the information is right. All of it hurts when the information is wrong, because the correction that used to happen on a Tuesday afternoon now happens on a truck.

How much of a data center’s cost is electrical work?

Data centers are not big office buildings with more outlets. On this work the electrical scope has moved from a supporting line on the cost sheet toward the center of it, which changes who carries the risk when something goes wrong and how much leverage the trade has at the table.

On an AI data center, electrical is the biggest line on the cost sheet. Turner & Townsend’s 2025 data center cost index puts electrical systems at 48% to 54% of construction cost, ahead of mechanical, and several times the shell. The inputs are getting more expensive, too: copper wire is up 17.9% from a year ago.

The International Brotherhood of Electrical Workers estimates 45% to 70% of the construction budget goes to the electrical subcontractor. That covers the sub’s full scope rather than one line on a cost sheet, and the union publishes it without showing its math. Still, a cost consultant and the electricians’ union, measuring different things, land in the same place: roughly half the job.

Electrical and power share of construction cost

Project typeElectrical/power shareSource
Typical commercial building15% – 20%Industry baseline
AI data center (2018)28% – 32%CBRE, JLL cost-stack analyses
AI data center (current)35% – 45%CBRE, JLL cost-stack analyses
AI data center, full electrical sub scope45% – 70%IBEW estimate

The IBEW figure measures the electrical subcontractor’s entire scope rather than a single line on a cost sheet, which is why it sits well above the CBRE and JLL numbers.

Why can’t electrical mistakes get fixed in the field on these jobs?

On most work, rework is a cost line. Somebody eats it and the job moves. On this work that tolerance is mostly gone, and the reason has less to do with craftsmanship than with what the building does once it is energized.

Chris Doyle has been in the trade since 1988 and works as a detail manager at Redwood Electric on an active data center project in Reno, Nev. The work has not only grown in volume, he said. It has raised the technical floor, “from single lines to ladder logic and the understanding of how these systems are supposed to work.” Not only for the people running jobs. “That’s the people that are building it.”

“At the end of the day, if there’s any mistakes in a UPS system, you’re talking about millions of dollars in downtime. The bar is very, very high, not just because we as an institution here want it to be, but because that’s what the industry demands.”

Most rework was never a field execution problem to begin with.

  • A Construction Industry Institute study of industrial projects found design changes, errors and omissions drove 79% of the cost of quality deviations. Construction deviations drove 17%.
  • A 2018 FMI and PlanGrid survey traced 48% of U.S. rework to poor project data and miscommunication, about $31.3 billion that year.

The field has spent decades absorbing mistakes made upstream. Prefab takes that away. The errors don’t stop. The shock absorber does.

The standards are still catching up. IEEE authorized Project P3710 in June 2025 to write design guidance for modular data centers, and it is still in development. The NEC and UL frameworks everybody works under were written for equipment installed in place, not built in a plant and shipped.

We have written before about what a 40-minute drawing hunt costs and why projects run late for reasons that have nothing to do with weather.

What’s really slowing down data center construction?

The six techniques all attack labor hours on site. Neither of the two things ultimately gating these projects lives there. Equipment and qualified people are procurement problems, not productivity problems, and no amount of speed in the field moves either one. Both get decided long before a crew mobilizes.

Gear. Wood Mackenzie’s Q2 2025 survey put power transformers at 128 weeks and switchgear around 44. Its 2026 read, reported by Data Center Knowledge, has substation transformers past 160 weeks, up from roughly 140 in 2023.

Electrical equipment lead times

EquipmentLead timeAs ofSource
Power transformers128 weeksQ2 2025Wood Mackenzie
Switchgear~44 weeksQ2 2025Wood Mackenzie
Substation transformers~140 weeks2023Wood Mackenzie via Data Center Knowledge
Substation transformers160+ weeks2026Wood Mackenzie via Data Center Knowledge

Wood Mackenzie’s most recent per-equipment survey is from Q2 2025. Its 2026 substation transformer figure was reported by Data Center Knowledge.

Lead times are cyclical and will come down. Distribution transformers already have, falling from more than 100 weeks in 2023 to about 30. Schneider Electric announced in March 2025 it will invest more than $700 million in U.S. operations through 2027, including switchgear and medium-voltage production. Shorter lead times still do nothing to restore the ability to adjust a prefabricated room after it comes off the truck. The shortage is a cycle. Front-loaded risk is a change in how the work gets built.

People. Google’s May 2025 white paper “Powering a New Era of American Innovation” reports that nearly 10,000 American electricians retire or change careers each year against about 7,000 new entrants.

The Bureau of Labor Statistics counted 818,700 electricians in the U.S. in 2024, projects 9% employment growth through 2034 and expects about 81,000 openings a year.

Watch what the companies with the most riding on these things are doing about it. Google.org funded the electrical training ALLIANCE, the joint IBEW-NECA apprenticeship organization, targeting 100,000 electrical workers and 30,000 apprentices. Siemens set a goal of bringing 200,000 electricians and manufacturing experts into the workforce by 2030.

One company doing that is a press release; two is a signal about which input is hardest to source. The money is going to apprentices, not another robot.

What should electrical contractors change to win this work?

The answer to industrialization is not working faster. Rather, it is refusing to rebuild the same thinking on every job while everything around you gets standardized. The firms that will hold margin here are the ones treating their own process as an asset with a version number, not something reassembled from memory each time.

Doyle argues data centers are more alike than most projects. “There’s an execution that can be about 80% the same,” he said. “So we shouldn’t have to start at zero like most projects tend to.”

The industry is moving his way. The Open Compute Project is building standardized reference designs for AI data centers, and Google contributed the first one, a facility design built around its TPU systems. But OCP’s own leadership describes the first wave of AI data centers as siloed, built with little coordination between vendors. The repeatable share runs high inside one customer’s program and lower across customers.

That tells you where to aim. The roughly 20% that does not repeat is where the job is won or lost, and the only way to have capacity left for it is to stop re-solving the 80%.

For an electrical sub, four habits:

  • Build tool sets once and reuse them, so takeoffs start from your standard, not from scratch.
  • Verify before release, not on arrival. Anything headed to a fab shop gets checked while changing it is free.
  • Treat submittals and RFIs as schedule work, not paperwork handled between other things.
  • Catch the conflict in design review while it is still a markup, because the field can no longer catch it for you.

The part that can’t be prefabricated

The pouring, the coating, the drilling, the connecting, all of it is getting faster and further from the hands that used to do it. The judgment that has to happen before any of it starts has not moved.

Somebody still has to know the drawing is wrong: that the anchor pattern doesn’t match the rack layout; that the routing won’t clear the structure; that the gear on the submittal isn’t the gear on the plan.

That work is getting more valuable, not less. The trades who do it consistently and can prove it get the calls.

Frequently asked questions

What percentage of data center construction cost is electrical work?

Turner & Townsend’s 2025 data center cost index puts electrical systems at 48% to 54% of construction cost, the largest single category. The IBEW estimates 45% to 70% measured as the electrical subcontractor’s full scope. Both figures exclude servers and IT equipment, which make electrical a much smaller share of total project cost.

How long are transformer and switchgear lead times in 2026?

Substation transformer lead times passed 160 weeks in 2026, up from roughly 140 weeks in 2023, according to Wood Mackenzie as reported by Data Center Knowledge. Wood Mackenzie’s most recent per-equipment survey, from Q2 2025, put power transformers at 128 weeks and switchgear at about 44.

Why is prefabrication riskier for electrical contractors on data center projects?

Factory-built assemblies lock decisions in before the crew arrives, so a drawing error the field once fixed with a Tuesday afternoon adjustment has to be caught before the assembly ships. That matters because most rework starts upstream: research from the Construction Industry Institute and from FMI traces it largely to design errors, changes and poor project data rather than field execution.

Is there a shortage of electricians for data center construction?

The Bureau of Labor Statistics counted 818,700 electricians in 2024 and projects about 81,000 openings a year through 2034, many from retirements and career changes. Google.org is funding an IBEW-NECA effort to train 100,000 electrical workers and 30,000 apprentices, and Siemens set a goal of adding 200,000 electricians and manufacturing experts by 2030.

Bluebeam builds software for specialty contractors, MEP trades and energy and infrastructure teams. See how AI-assisted drawing review changes what gets caught before the truck shows up.

Catch the conflict while it’s still a markup.

Common design errors in construction drawings, and why reviewers keep missing them.

Sometime around 2018, Jean-Pierre Trou sat down at his dining room table in Austin, Texas, with 250 pages of drawings and a red pen. Three stories, 90,000 square feet, architectural plans stacked against structural and MEP. The review took him a week. We wrote about that table.

Anybody who’s done that work knows how it goes. You’re sharp on sheet 12. You’re a different reviewer by sheet 240.

The errors that get through are almost never the hard ones.

Why do the same drawing errors keep showing up?

Reviewer attention is a budget, not a switch. The industry treats a missed dimension as a discipline problem and answers it with more checklists and sets of eyes. The research on how people search points somewhere else, at a failure that shows up in any job built on hunting for something rare.

Ask why a missing door tag reached the field, and you’ll get some version of somebody should have caught that. Yet there’s a better answer: The errors get missed because they’re rare, and rare is where trained eyes fail.

Start with the airport. In a visual search study published in Nature, people missed 7% of targets when the target turned up in half the images. Drop it to 1% of images and misses jumped to 30%. Same people, same task. The only change was how often there was something to find.

That’s the problem with a clean set. Two hundred good sheets teach you the next one is good too, so you stop looking a little sooner each time. You’re not scanning worse, just quitting earlier.

Then there’s the study that should bother anyone who reviews drawings for a living. Researchers asked 24 radiologists to hunt for lung nodules in CT scans and dropped an image of a gorilla into the last case, 48 times bigger than the nodules they were hunting. Eighty-three percent didn’t see it. Eye tracking showed most of them looked right at it.

That one gets thrown around as proof that experts are no better than anybody else. The authors drew a narrower conclusion. Even expert searchers, working in their own field, are vulnerable to this. Their attention was tuned to nodules, which is why a gorilla didn’t register. As one of the researchers later put it, these weren’t bad radiologists, just human ones.

Nobody has run this test on a drawing set. The mechanism carries. The proof doesn’t.

Stack that on real volume. At workplace design firm Oktra, a drawing pack runs about 60 sheets and passes 100 with subcontractor drawings in, through roughly eight rounds of design review, with comments coming from design, coordination, cost, the client and suppliers.

What are the most common errors found in construction design review?

Most design errors aren’t exotic. They fall into a handful of shapes that repeat from job to job, which is what makes them worth naming out loud. A reviewer working a short list of known shapes is doing something different from one reading every sheet with the same attention and the same fatigue.

The research sorts these by cause. The UK’s Get It Right Initiative traces a large share of construction error back to design that is uncoordinated, incomplete, late or miscommunicated, and its design guide is built around fixing that upstream. Useful if you run a firm.

On the sheet, at 9 p.m., it looks like this.

The errorWhat you’re looking atWhat it turns into
Dimension conflictsThe same element dimensioned two ways on two sheetsWhichever sheet the field reads first becomes the building
Missing or wrong tagsDoors, fixtures or equipment on the plan but not the scheduleA submittal for something nobody can identify
Gridline mismatchesStructural and MEP working off grids that don’t agreeA clash nobody modeled
Missing sheetsA detail callout pointing to a sheet that isn’t in the setAn RFI on day one of the trade’s work
Spec-to-drawing conflictsThe drawing says one product, the spec says anotherSomebody prices the wrong one
Scope gapsWork sitting in the seam between two packagesBoth trades assume it belongs to the other
Revision driftA change that landed on one discipline’s set and not the restThe set is current and wrong at the same time

These stick around. A 2019 study of BIM coordination on two public projects found 67% of design discrepancy issues, and half of repeated clashes, still open when construction finished. They don’t just happen. They survive.

The last two are process failures wearing a drawing problem’s clothes. Comments scatter across email and meeting minutes, versions blur and markups get repeated. Oktra’s answer was one authoritative markup set for every downstream use. “If we’re going to review something, we do it properly once, not three different times for three different audiences,” Creative Director Jenny Edwards told us. Keeping the set straight is a document management problem, and it feeds everything downstream.

Which of these needs a human?

The useful split isn’t hard vs. easy. Rather, it’s whether a question has one right answer or takes somebody who knows how the building goes together. That line decides what belongs to software and what stays with a person, and it’s where most review time gets spent in the wrong place.

Four of the seven have exactly one right answer.

  • A tag matches the schedule or it doesn’t.
  • A grid aligns or it doesn’t.
  • A referenced sheet exists or it doesn’t.
  • A revision landed on every set or it didn’t.

None of that takes field experience, and every one is rare on any given sheet, which is where the search research says people fall down.

The other three need somebody who’s built something. A spec-to-drawing conflict is often an ambiguity, not a mismatch. A scope gap depends on how the work gets sequenced. Those are judgment calls, and judgment is what a reviewer should spend the good hours on.

Why this took so long to automate comes down to what a drawing is. A square might be a wall. It might be a table. You know which because you know what you’re looking at. Software didn’t. Tech entrepreneur Shir Abecasis made the longer case in AI Can Read Your Specs. But Can It Read Your Drawings?.

That’s where the tools have landed. In Bluebeam Max, Smart Review scans the set for the tag, sheet and gridline family. Smart Overlay flags changes across disciplines and drawing scales, which is revision drift, handled directly.

What changes when the first pass isn’t manual?

The value of catching an error early is easy to assert and hard to prove, which is why the numbers around rework are so unreliable. What changes when the scanning gets handed off has less to do with hours saved than with what a reviewer can put their name on.

Start with a number that cuts against the pitch. Peter Love has spent two decades studying rework. This year he went into a contractor’s actual cost records and found rework before completion averaged 0.38% of contract value, or 0.76% counting post-completion fixes. He notes the rework costs reported in the literature vary widely, depending on who is defining rework and how they are counting it.

The gap is the story. Nobody knows what this costs, including the people paying for it.

Downstream is easier to see. Navigant’s study of 1,362 projects and roughly a million RFIs found 9.9 RFIs per $1 million of construction cost, with a median 9.7 days to get an answer. Every one of those is a question somebody had to stop and ask.

Two caveats. That data is from 2013 and skews toward Australia and New Zealand, and Navigant’s own warning holds. A high RFI count doesn’t by itself prove the design was bad.

What teams report has less to do with hours. Rudolph and Sletten completes preconstruction reviews 30% faster running them in Studio. CannonDesign managed design review on a $2 billion hospital, which is the volume problem in its purest form.

Steve McElwee, director of construction at Foresight Custom Homes, put it in bid terms. AI reviewing the drawings alongside your own process lets you bid more accurately, knowing nothing slipped through.

The part nobody says out loud

Nobody in this business expects a perfect set. Ask any architect whether one exists and watch the reaction.

That’s not a complaint so much as the premise. If the set was never going to be perfect, catching things is the whole job, and the boring half of that shouldn’t depend on somebody being as sharp on sheet 240 as on sheet 12.

The table is still where quality control happens. The complete guide to construction design review covers the rest of the workflow, and the design review and QA/QC workflow page covers how it runs in Bluebeam.

Frequently asked questions

What are the most common errors found in construction design review?

Seven categories account for most of them: dimension conflicts between sheets, missing or inconsistent tags, gridline mismatches across disciplines, missing sheets and dead references, spec-to-drawing conflicts, scope gaps between trades, and revision drift where a change reaches one discipline’s set but not the others.

Why do experienced reviewers miss obvious drawing errors?

Because the errors are rare. Visual search research shows miss rates climb sharply as targets become less frequent, and a study of 24 radiologists found 83% failed to notice a gorilla image inserted into a CT scan while hunting for lung nodules. The authors concluded that even expert searchers, working in their own field, stay vulnerable to missing what they are not looking for.

Can AI catch design errors before construction starts?

It can catch the deterministic ones. Tag mismatches, gridline inconsistencies, missing sheets and unpropagated revisions are rule-checkable, and software doesn’t get tired at sheet 240. Conflicts that require reading design intent, like an ambiguous spec-to-drawing discrepancy or a scope gap between trades, still need a person. Bluebeam Max runs the first pass with Smart Review and Smart Overlay.

Does a high RFI count mean the design was bad?

Not on its own. Navigant’s research found roughly 9.9 RFIs per $1 million of construction cost across 1,362 projects, and cautioned that a high RFI count does not by itself indicate defective plans. Treat RFI volume as a signal worth investigating rather than a verdict on the design.

Let software take the first pass at the boring half.

A commercial project manager by day, a construction satirist by night. Joey Brown thinks the two jobs are the same.

Halfway through his interview for this story, Joey Brown’s video froze.

The audio held. Someone suggested he cut the camera and keep talking. “Do you guys hear me now?” he asked, and then picked his answer back up where he’d left it.

That’s Joey Brown in one scene: two jobs running at once, and neither one waiting on the other.

Two Jobs, Same Guy

By day, Brown manages schedules, submittals and subs as a commercial construction project manager, most recently with Taft Construction in Culpeper, Virginia. By night (and lunch break, and red light) he’s @__joeybrown__, 31,200 followers deep into a hashtag he’ll happily admit is corny: #MakeConstructionFunAgain.

“It’s a little on the nose,” he says. He keeps using it anyway.

The two jobs shouldn’t fit together as easily as they do. They do, because both come down to the same thing: getting people who don’t usually listen to each other to hear one another. That’s the whole job on a jobsite. It turns outit’s also the whole job on a phone screen.

A ‘Total Accident’

Ask how the second job started, and Brown doesn’t dress it up.

“It was a total accident,” he says. A college friend who’d interned alongside him at a Hampton Roads contractor started posting on TikTok and talked him into trying it. Brown figured it might be a side hustle, nothing more. Then the messages started.

“People actually care about what I have to rant about,” he says. “Maybe I should do this.”

By then, he’d already put in the years on the first job: an internship at 20, a mechanical engineering technology degree from Old Dominion University, a climb to project manager.

The career came first. The camera just found someone who already knew how to explain one department to another, then pointed that instinct at a bigger room.

The Bit, the Instruction

Scroll his social media feed and you’ll find two different things happening.

One half is a rotating cast of characters, all of them blaming each other for the same jobsite headache: GC project manager, GC superintendent, architect, engineer.

The other half is straight instruction. Sprinkler lines vs. ductwork. How to read coordinated drawings. What’s going on with the bottom half of a fire hydrant. Hard hat brim back, wraparound sunglasses, usually filmed from a truck cab, whichever job he’s doing that day.

Both halves work for the same reason. Brown has sat in every one of those chairs, so the jokes land like recognition instead of mockery.

There’s a bill attached to the joke, too. A 2018 survey of nearly 600 construction professionals conducted by FMI Corp. found that poor communication accounted for 26% of all rework in the U.S., a potential cost of roughly $17 billion a year. Bad project information accounted for another 22%.

“I’ll have a civil engineer who will message me and say, ‘Hey, I really never thought about that,’” he says. Even the general contractor bit took some getting used to. “I just would like to think that I’m one of the better ones,” he says. “So, it was difficult for me to make fun of myself, which I have practiced.”

Making It Look Like a Good Job

The construction workforce is older than the country’s. The median age in the industry is 42, a year above the national labor force, according to the National Association of Home Builders’ analysis of the Census Bureau’s American Community Survey. Baby boomers still made up 14.2% of it as of 2023, and most of them are heading toward the door.

Brown’s read on it is less a strategy than a bet.

“I have a suspicion that it’s going to solve itself with supply and demand,” he says. “The more social media covers financial wellness, and then, of course, people are willing to pay tradespeople more and more, I think that more and more young men and women will join the trades.”

He doesn’t claim to be part of the fix. The research suggests people like him already are. In Thumbtack’s 2024 “Future of Skilled Trades” report, 55% of Generation Z respondents said they were considering a trades career, up 12 points in a year, and two out of three said social media had increased their interest. Among those with a college degree, it was three out of four.

The bet may already be paying off. Gen Z’s share of the construction labor force more than doubled between 2019 and 2023, from 6.4% to 14.1%.

Brown would probably wave that off. He’s just a guy in a hard hat, on camera, making the work look like a good time and a good living.

Fair to Both Sides

Brown doesn’t go easy on either half of his own audience.

On the industry he works in: “The white-collar side of the industry can be so serious and so polished,” he says, “and it is such a huge mess in comparison to the people in the field actually performing the work.” He doesn’t stop there. “There is just so much animosity at all times,” he says. “It doesn’t need to be that way.”

He’s just as hard on the people who’ve never set foot on a site. Walk one onto a big commercial project and the noise gets them first. Steel hanging overhead. Dump trucks backing up. Off-road equipment working the dirt. Voices carrying across an open slab. “People yelling,” as Brown puts it, “not because they’re angry, but because that’s how you have to communicate sometimes.” Most spend their first couple of days simply overwhelmed by it.

Then something else lands. “This is actually genuinely dangerous, loud and intimidating,” he says.

None of which comes through from the outside. “You have no real perspective whatsoever of what it is like to pour concrete when it is 100 degrees outside for an entire summer,” he says. His comparison: someone mulching their yard on a Saturday, calling it hot.

“That’s nothing.”

Boxes of Paper

The same gap between old and new shows up in his tools. Brown remembers 60-plus-page submittals, five to eight copies hauled into a single meeting, boxes of paper riding in the back of a truck to get there.

Now the work itself lives inside the software, and Brown’s reaction the first time he showed it to someone outside construction has stuck with him. “How is this gate kept?” he says of Bluebeam. “Is it just construction?”

Every Building Is a First Attempt

Ask Brown to explain why the industry moves the way it does and he gives you the most honest answer available.

“Construction is behind schedule because it is immensely complicated, and every single building is the first attempt at that structure,” he says. The crews aren’t new to the work; they’re new to this building. “It’s their first time building that building.”

No assembly line, no template, no muscle memory to fall back on. He’s not wrong, though the industry has more say in it than that. McKinsey’s construction productivity research found that only half the firms it surveyed kept a standard design library, and it names repeatable design elements as one of the sector’s biggest missed opportunities. Some of the one-off-ness is the work. Some of it is habit.

“The immense amount of complexity within construction is lost,” he says, “and no one really understands it until they’ve lived it for a while.”

That’s the industry Brown works in every day, and the one he spends his nights explaining on social media. He just happens to keep standing inside two versions of it at once.

“Everyone should look at the industry and try and put themselves in other people’s shoes,” he says, “because all of it is difficult in its own way.”

Including his own.

See what a project manager’s day runs on.

Quantity takeoff, material takeoff and cost estimate are three different jobs. When they collapse into one, you lose the ability to answer the only question that matters in review.

The slab measured 185 cubic yards. The truck delivered 195.

Somewhere between those two numbers, someone made a decision. Maybe it was a 5% waste factor. Maybe it was pump priming and a subgrade that came in uneven. Maybe it was a purchasing manager who has been burned before and rounds up on principle. Any of those is defensible. What is not defensible is not knowing which one it was.

That gap, the 10 yards nobody can account for, is what happens when quantity takeoff, material takeoff and cost estimate get treated as the same activity. They are three distinct steps with three different owners doing three different jobs. Blurring them does not just muddy the paperwork. It costs you the ability to defend a number six months later, when the person asking is a project manager and the answer had better be good.

Why do three different jobs share one name?

The vocabulary drifted because the work compressed. When one person measures, adjusts for waste and prices in a single sitting, the language stops distinguishing steps that used to belong to separate desks. The terms did not become interchangeable. The workflow simply stopped making the seams visible.

There was a time when these three documents were produced by three different people, often in three different rooms. A takeoff clerk measured. A purchasing agent turned those measurements into orders. A chief estimator applied pricing and decided what the number would be. The handoffs were physical, so the distinctions were obvious.

Digital workflows collapsed that sequence onto one screen, and, in most firms, onto one person. That is a real productivity gain. It is also how the language got sloppy. Add the fact that “takeoff” works as both a verb and a noun, and that most software in this category is marketed as “takeoff and estimating,” and you end up with an industry using one word for three jobs.

The confusion is a language problem. The consequences are not.

What does a quantity takeoff establish?

The quantity takeoff is the only layer of an estimate that does not belong to anyone’s judgment. It belongs to the drawings. That is the source of its authority, and the reason it has to stay unnegotiated. The moment an estimator’s opinion enters the measurement, the number stops being evidence and starts being an argument.

A quantity takeoff (QTO) measures the net in-place quantities required to build the project as designed. Lengths, areas, volumes and counts, captured directly from the construction documents, with no adjustment for waste, packaging or field inefficiency.

Square footage of flooring shown on the plan. Cubic yards of concrete defined by slab thickness and footprint. Fixture counts pulled off the reflected ceiling plan. The QTO is the project’s geometric truth, and it answers exactly one question: What exists on paper?

A clean QTO leaves four things out on purpose:

  • Waste factors for cuts, spillage and breakage
  • Packaging logic, standard sizes and order minimums
  • Labor productivity assumptions
  • Any form of pricing

The test is not whether the total feels right. It is whether a second estimator, handed the same sheet set, would land on the same number and be able to see how you got there.

The QTO defines scope, not strategy. Nothing about how you plan to buy the material, sequence the work or price the job belongs anywhere near it.

How is a material takeoff different?

A material takeoff is the first place construction reality gets a vote. Waste, breakage, standard sheet sizes and the uneven subgrade nobody drew are all legitimate inputs, and they all reflect somebody’s experience rather than the drawing set. That is precisely why they need their own container instead of being folded into the measurement.

The material takeoff (MTO) builds on the QTO but answers a different question: What do we need to buy?

This is where net quantities become gross quantities. Waste factors for cuts, spillage and breakage. Packaging and standard sizes, because drywall comes in sheets and rebar comes in lengths. Overlap allowances for roofing and siding. Overage for constructability, including the pump priming and the subgrade variability that turned 185 yards into 195.

The MTO is a procurement tool. It supports purchasing, logistics and delivery planning. It is not a bid comparison document, and it is not a scope validation document. Treating it like one is how contractors end up bidding their own waste factors, paying markup on the same material twice: once in the volume and again in the unit price.

A clarifying way to think about it: Two contractors bidding the same job should produce nearly identical quantity takeoffs and meaningfully different material takeoffs. The QTO reflects the design. The MTO reflects the builder. If two QTOs disagree, somebody misread the drawings. If two MTOs disagree, that is just two companies with different suppliers, different crews and different tolerances for running short.

Where does the cost estimate fit?

Pricing is the layer everyone watches and the layer with the least power to fix anything. A sharp unit cost applied to a wrong quantity produces a confident, well-formatted mistake. The estimate inherits whatever the takeoff got wrong, and no amount of discipline downstream can reach back upstream and repair it.

The cost estimate is where quantities meet money. Unit prices, labor productivity rates, equipment costs, indirect costs, general conditions, contingency and profit. This is the step that produces the number you submit and then live with for the next 18 months.

No amount of pricing accuracy can fix bad quantities. If the takeoff is wrong, the estimate will be wrong, whether it comes in high or low. The quantity takeoff is the independent variable. Every other number in the file depends on it.

The three layers

LayerQuestion it answersPrimary ownerWhat it must never containIt changes when
Quantity takeoffWhat do the drawings show?EstimatingWaste, allowances, pricing logicThe drawings change
Material takeoffWhat do we need to buy?ProcurementLabor rates, margin, contingencySuppliers, site conditions or means and methods change
Cost estimateWhat will it cost to build?Estimating and leadershipUnverified quantitiesMarkets, labor rates or risk appetite change

Why does keeping the layers separate matter in practice?

Separation is not bookkeeping hygiene. It is what makes an estimate survivable under interrogation. Estimating is a discipline that gets judged retroactively, months after the fact, by people who were not in the room. The layers exist so that any number can be walked backward to the decision that produced it.

Three moments make the case, and every estimator has lived through all of them.

The addendum lands three days before bid

The architect moves a wall. With clean layers, you update the affected quantities in the QTO, let the change flow into the MTO where it affects procurement, and reprice only what moved. With collapsed layers, you cannot isolate the change, because you cannot tell which part of the number was the drawing and which part was the waste factor. Now the revision is a full rebuild, and you are doing it on a Tuesday night.

The PM questions a number in month six

You want to open the sheet, point at the markup and say: Here is what we measured, here is what we ordered and here is why those are different. Three sentences, and the conversation is over. If waste and pricing were baked into the measurement, you cannot produce those three sentences. You produce a shrug, and shrugs are expensive.

A new estimator joins the team

Consistency across a team is impossible when every estimator has a private convention for where decisions live. One buries a 7% waste factor in the takeoff. Another applies it downstream. Their numbers will never be comparable, and no amount of peer review will fix a problem that starts with structure.

How do you know your layers have already collapsed?

The failure is quiet. Nobody announces that scope and procurement logic have fused. It shows up as friction that gets rationalized as normal, which is why the symptoms are worth naming out loud rather than waiting for a bad job to name them for you.

A few reliable tells:

  • You cannot say what your waste factor is without opening a file, because it lives inside the measurements rather than beside them.
  • Procurement calls to confirm quantities before every order, because they do not trust that the number they received is the number they should buy.
  • A drawing revision triggers a full remeasure instead of a targeted update.
  • Two estimators measure the same scope and produce totals that do not reconcile, and nobody can explain the delta.
  • Someone asks where a number came from and the honest answer is that it came from the last estimate on a similar job.

None of these is a software problem. They are structural ones, and they get solved before the first measurement is placed, by deciding where each kind of decision belongs and then holding that line.

Three steps, one workflow

Quantity takeoffs, material takeoffs and cost estimates are not competing methods. They are sequential layers, and each one inherits whatever the layer before it got wrong.

The QTO defines what the drawings show. The MTO determines what gets purchased. The cost estimate calculates what it costs to build. Keep those three jobs in three separate containers, and the estimate stays reviewable, revisable and defensible under pressure.

So the next time someone on your team asks for “the takeoff,” ask them which one they mean. If nobody in the room can answer cleanly, that is the actual problem, and it is not going to fix itself at bid time.

Frequently asked questions

What is the difference between a quantity takeoff and a material takeoff?

A quantity takeoff measures the net in-place quantities shown on the drawings, with no adjustment for waste or packaging. A material takeoff converts those net quantities into gross purchase quantities by adding waste factors, standard sizes, laps and overage. The QTO defines scope. The MTO supports procurement.

Should waste factors be included in a quantity takeoff?

No. Waste belongs in the material takeoff, not the quantity takeoff. Baking waste into the measurement makes quantities impossible to audit against the drawings and makes drawing revisions far harder to isolate, because you can no longer separate what the plan showed from what you decided to order.

Can an accurate cost estimate compensate for an inaccurate takeoff?

No. Pricing is applied to quantities, so the estimate inherits every quantity error. Sharper unit costs and better labor rates cannot correct scope that was never measured. The quantity takeoff is the independent variable; everything downstream depends on it.

Is a material takeoff the same as a bill of materials?

They overlap but are not interchangeable. A material takeoff is derived by the estimator from the drawings and adjusted for waste, packaging and constructability. A bill of materials is typically a specified list of components tied to a design, an assembly or a manufacturer. The MTO answers what to order for this job under these conditions. A bill of materials answers what the design specifies.

Who owns the material takeoff?

Procurement typically owns it, though estimating often produces the first version. What matters more than the org chart is that the MTO exists as its own artifact rather than living inside the quantity takeoff, so that purchasing decisions can be reviewed and revised without disturbing the measured scope.

See what a defensible takeoff looks like.

The hidden price tag on familiar workflows — and why the math is getting harder to ignore.

Picture a superintendent on a commercial job, 10 weeks from substantial completion. They’re not behind on approvals or missing a deadline. They’re looking for a drawing.

Not a drawing that doesn’t exist. A drawing that does exist, somewhere, in one of four shared drives their team has accumulated across three years of project turnover. They find it 40 minutes later. It’s version 7, and they needed version 9.

Nobody budgeted for that 40 minutes. Nobody budgeted for the calls that followed, or the rework that came after. That’s the thing about document management failures: they don’t present as failures. They look like Tuesday.

The construction industry has built an entire operating culture around workflows that feel good enough — until you calculate what good enough is costing you. Bluebeam works with more than 4 million construction professionals worldwide, and this pattern shows up everywhere: in the data, on the jobsite, and in the stories crews tell about the moment they finally changed how their teams work.

Those patterns are confirmed by Bluebeam’s own research. The AEC Technology Outlook 2026, a global survey of more than 1,000 construction professionals published in October 2025, found that only 11% of AEC firms are fully digital across all project phases. The other 89% are still relying on paper, spreadsheets and legacy tools — especially in the field and during closeout, where document integrity matters most.

This piece makes the case for why that gap matters — in dollars.

Bluebeam’s Document Management for Construction 2026 Guide goes deep on what a modern document workflow looks like. What follows is the business case for why it matters.

The Gap Between ‘Digital’ and Actually Digital

Every firm in construction will tell you they’ve gone digital. In a narrow sense, most of them have. PDFs replaced paper; email replaced fax; shared drives replaced filing cabinets. That counts.

Still, digital tools and digital workflows are not the same thing. Nearly half of AEC professionals still rely on paper during design or handover, according to the AEC Technology Outlook 2026. Nearly 40% report challenges managing collaboration across the full project lifecycle, especially when crews are siloed between design, construction and operations. Meanwhile, 23% cite integration complexity as their top barrier to adoption — higher than cost, higher than time, higher than lack of leadership buy-in.

That partial digitization is exactly where the cost hides. The filing cabinet is gone, but the chaos it represented hasn’t been. It’s been distributed across inboxes, cloud folders, and markup files with names like “final_FINAL_v3_revised.pdf.” Field teams are hunting for information across systems that don’t talk to each other, and that hunt shows up on the job as wasted time, cost overruns and risk.

The tools are there. The connection between them often isn’t.

What 14 Hours a Week Costs

The most detailed look at where construction crews spend their time comes from the FMI and PlanGrid “Construction Disconnected” study, a 2018 survey of nearly 600 construction leaders. The finding that should stop any PM cold: construction professionals spend 35% of their time — more than 14 hours a week — on what the study called “non-optimal” activities. Hunting for project data; resolving conflicts; dealing with rework. In other words, not building or managing. Looking.

The breakdown is worth sitting with. Of those 14-plus hours, 5.5 go to chasing down project information. Another 4.7 go to conflict resolution. The remaining 3.9 go to mistakes and rework. Across the US construction workforce, that wasted time carries an estimated annual labor cost of $177.5 billion.

That figure is specific, to be sure, to 2018 dollars and one methodology. Yet the directional argument holds regardless: when your most experienced people are spending a third of their week chasing information rather than making decisions, you’re paying a tax on every hour you’ve hired them. That tax doesn’t show up on any job cost report.

Rework, RFIs and the Paper Trail Nobody Wanted

The time loss is real. Yet it’s the downstream consequences that turn an efficiency problem into a business problem.

Start with rework. The Construction Industry Institute’s field rework research, drawn from a database of 144 industrial projects, established the benchmark the industry still cites: direct rework costs run about 5% of total construction cost. That figure understates the actual hit because rework is systematically underreported — roughly a third of the project teams CII surveyed believed their recorded rework captured only 50% to 75% of what occurred.

What’s more, the 2018 FMI and PlanGrid study put a dollar figure on it: $65 billion of US construction spending goes to rework annually, and $31.3 billion of that — 48% — traces back to poor communication and bad project data. Not bad workmanship. Bad information.

The broader picture is starker. A 2021 Autodesk and FMI study estimated that inaccurate, incomplete or inaccessible project data cost the global construction industry $1.85 trillion in 2020, driving $88.69 billion in rework alone. Thirty percent of respondents said more than half of their project data was “bad” in some way — inaccurate, outdated, inaccessible or entered twice.

Then there are RFIs. A Navigant Construction Forum analysis of roughly 1.1 million RFIs across 1,362 projects found that the average project in the sample generated 796 RFIs, each costing an estimated $1,080 to review and respond to. That works out to about $860,000 per project in RFI processing alone.

The median response time in the analysis, meanwhile, was 9.7 days. And roughly 22% of RFIs never got a response at all — a rate Navigant called a leading indicator of deeper trouble, from an overwhelmed response system to no real controls over how RFIs get processed in the first place.

Change orders add another layer. An AIA analysis of nearly 900,000 change orders across more than 18,000 completed US building projects found that change orders average 4% to 5% of contract value, with the top of the typical range running about 15%.

More useful than the average, though, is the timing: most change orders land in the back half of a project, and AIA found that the later one arrives, the fewer options an owner has and the more it tends to cost.

This is another way of saying the expensive changes are the ones nobody saw coming — because the information that would have surfaced them was sitting somewhere no one could reach.

None of these, to be clear, are acts of God. They’re what happens when crews on the same job are working from different versions of the same information.

The Productivity Gap That Makes It Worse

The document management problem doesn’t exist in isolation, either. It sits inside a broader productivity problem that construction has been living with for decades.

McKinsey Global Institute’s 2017 analysis found that global construction labor productivity had grown only 1% per year over two decades, compared to 2.8% for the total world economy and 3.6% for manufacturing. In the US, construction labor productivity is lower today than it was in 1968.

A 2023 McKinsey update found that construction productivity improved only 10% between 2000 and 2022 — while the broader economy improved 50% and manufacturing improved 90% over the same period.

That stagnation has many causes, and document management is one of them. When nearly a third of a crew’s week goes to finding and reconciling information, no technology investment fully compensates for it. The workflow has to change.

Bluebeam’s Document Management for Construction 2026 Guide lays out what that change looks like in practice — from version control protocols to real-time collaboration workflows to closeout documentation that doesn’t require a four-month archaeological dig.

Why the Math Is More Urgent Now

The inefficiency was always there. What’s changed is the margin available to absorb it.

GC net margins sit around 5%-6% in a good year, and about one in six contractors say they’ve absorbed recent cost increases themselves rather than pass them through — a strategy that works until it doesn’t.

Meanwhile, construction wages rose 4.2% year over year as of August 2025, and Associated Builders and Contractors estimated the industry needed to attract 439,000 workers in 2025 alone — a number it raised to 499,000 for 2026.

Effective tariff rates, moreover, on construction goods hit a 40-year high of 25% to 30% in 2025, according to Deloitte’s 2026 Engineering and Construction Industry Outlook. AGC’s producer price data shows what that did downstream: aluminum mill shapes up 30.5% across 2025 and steel mill products up 17%, the steepest increases since 2022. Total US construction spending, meanwhile, was down almost 3% year over year by July.

When every cost input is moving the wrong way at once, self-inflicted costs start to matter in ways they didn’t when margins were thicker. Rework that was a nuisance at 12% margin can be existential at 5%. RFI delays that were an annoyance on a fully staffed project become critical path issues when you’re already shorthanded.

There’s a workforce dimension, too.

The AEC Technology Outlook 2026 found that 44% of firms say advanced technology plays a key role in attracting and retaining workers, alongside culture and pay. In an industry already facing a serious labor shortage, document chaos isn’t just an efficiency problem; it’s a recruiting problem. Younger workers notice when they’re handed outdated systems on day one.

The firms absorbing these costs without fixing the underlying workflow aren’t just losing money on individual jobs. They’re building structural disadvantages into how they operate.

What Good Looks Like

The answer isn’t another tool, but a different way of working. The firms that have made the change are producing results that show up on the bottom line.

Consider DPR Construction’s experience on the Alta Bates Summit Medical Center project in Oakland. Facing a 31-day schedule delay and an accelerated rebar fabrication timeline, DPR turned to Bluebeam Studio Sessions to run simultaneous, real-time collaborative reviews with the engineer of record and rebar detailer.

By reviewing and resolving shop drawing issues in a live session rather than passing PDFs back and forth, the team cut the submittal review cycle by more than 33% — compressing a 25-to-30-workday process into a 10-to-12-day window. That’s up to 10 days of schedule recovery per review cycle, on a project where every day had a dollar figure attached to it.

The results at Balfour Beatty’s DFW Airport renovation tell a similar story: $5 million in project savings attributed to centralizing documents and giving field teams real-time access to the information they needed, when they needed it. The savings didn’t come from a technology initiative; they came from fixing how information moved through the project.

Those aren’t outliers. They’re what Bluebeam sees when firms close the gap between having digital tools and ultimately running digital workflows. Among the 27% of construction firms currently using AI tools, 68% report saving at least $50,000 on recent projects, and 46% have saved 500-1,000 hours by applying AI to scheduling, planning and document analysis, according to the AEC Technology Outlook 2026.

What the firms getting these results have in common isn’t a particular software stack. It’s a single source of truth for project documents, accessible to every stakeholder in real time. It’s markups that are tracked, versioned and auditable — not living in email attachments. It’s RFI and submittal workflows that move in hours, not days. It’s a closeout process that doesn’t require assembling a package from five different places at the end of a job.

Bluebeam is built specifically for this kind of work — document-based collaboration that spans disciplines, formats and project phases without requiring firms to overhaul their entire tech stack. Bluebeam Max brings together markup, collaboration and project management in a single platform built for AEC workflows from design through closeout. Bluebeam’s customer stories offer a closer look at what these workflows produce in practice across firms of every size and type.

The Question Worth Asking

There’s no line item on a job cost report for “time spent looking for the right drawing.” There’s no budget category for “rework caused by working off the wrong version.” These costs are real, recurring and largely invisible — which is exactly why most firms haven’t done the math.

The math, when you do it, is uncomfortable. Hundreds of thousands of dollars per project in RFI management alone. Five percent of project value in rework, half of it caused by bad data. More than 14 hours a week per worker spent on things that aren’t building anything. Across a firm’s project portfolio, those numbers stop looking like friction and start looking like a structural problem.

The firms winning in this market — on thinner margins, with tighter crews — haven’t found ways to absorb those costs. They’ve found ways to stop incurring them.

If your team is working harder than the project warrants, the answer might be in how your documents are — or aren’t — moving. Bluebeam’s Document Management for Construction 2026 Guide is a good place to start that conversation.

See what a clean document workflow does on a live job.

One welding inspector’s mission to use metalwork as the way through, for anyone who walks up to her booth doubting they belong.

On the show floor at FabTech, a young woman charged at Shanen Aranmor, a certified welding inspector, giving her a huge hug. Aranmor didn’t recognize the woman, but the woman recognized Aranmor. The young woman explained she saw Aranmor present at a SkillsUSA competition years earlier and it changed her. Sitting in a room full of men, spotting one woman, and one in a position of authority, made this young woman believe she belonged in that room too.

The moment caught Aranmor off guard. She’d never had a female mentor in welding. None of the women she works with in the industry had either. “It didn’t occur to me that representation mattered,” she said. “We didn’t have it, so we didn’t know what it could do for somebody.”

So, her first project wasn’t a trade school or a workforce pipeline. It was establishing Weld Like a Girl, where she uses welding as the vehicle that helps people blast through limitations.

From the Junk Drawer to the Welding Booth

Aranmor was the kind of kid who would dump out her grandmother’s junk drawer and try to make things from the random collection of hardware and odds and ends. She loved her metal shop class in junior high and was the first girl in her school to take Metal Shop 2. When she won her junior high graduation award for metal shop, she accepted it in a skirt and heels.

Her high school didn’t offer metal shop, and she drifted away from metalwork. She became a licensed therapist, working with sexually abused children and their families. The work was meaningful and emotionally brutal.

Aranmor became a college professor in psychology and wellness and moved to college administration. She found herself in a world she describes as angry. From students to faculty to administrators and staff, everyone was angry at someone. She needed an outlet to manage her stress. She landed on blacksmithing. “You take a piece of metal, you stick it in a hot forge, and you can pound the crap out of it, and no one knows what you’re saying because you’re all wearing hearing protection,” she said. “It is seriously therapeutic.”

Blacksmithing also reignited her love of metalwork. When the blacksmithing professor announced his class was being discontinued, Aranmor volunteered to fill in. The head of the welding department agreed on one condition: she had to take a welding class first. Her first day in class, something clicked. “I think I understand addiction,” she said. Her immediate next thought was “we have to do this as a women’s empowerment workshop.”

Proving It Every Damn Day

That goal would have to wait. Aranmor spent six years as a certified welding trainer for Miller Electric, working as the company’s first woman trainer and one of only five trainers across North America.

At a training session in Portland, a man walked in on the first day and asked her, “Hey, toots. Can you get the teacher for me?” Aranmor stepped into the shop, steadied her breath, then walked out at eight o’clock, wrote her name on the board and got to work. During the day, that man peppered her with basic questions, testing her. He finally asked one she couldn’t answer. During a break, she researched the question and shared the answer with the class. “The feeling is, as a woman in the industry, you have to prove yourself every damn day,” she said. “Eventually you start getting repeat students. But then the next person comes in, and it starts over. Every damn day.”

During her time at Miller, she kept asking her boss to let her run women’s welding workshops in the communities she visited. The answer was always the same: it’s not in your job description. So, she made it her job description. The last time she asked and was told no, she gave her notice and launched Weld Like a Girl.

Welding as the Doorway

Weld Like a Girl was never designed just for women. Aranmor’s workshops are open to everyone, and she has taught participants as young as 5 and as old as 88.

Weld Like a Girl was never designed to be exclusively for women. Even before Aranmor had a physical shop, men and boys in the community expressed interest in learning welding too. So, the workshops are open to everyone. She runs themed classes where participants make everything from yard art to Minions welded from old helium cylinders.

Through Weld Like a Girl, Aranmor has taught participants as young as 5 and as old as 88. Second graders walk over from a nearby charter school twice a year. On one visit, they add a weld to a group sculpture. On the second, they build their name out of nuts and bolts to take home.

She tells her participants, “If you do something here that you didn’t think you could do and you succeed, what are you going to be able to accomplish now?”

“If you do something here that you didn’t think you could do and you succeed, what are you going to be able to accomplish now?” Aranmor asks her participants.

The group also works with local charter high schools, one of which is connected to the juvenile courts. Together with Aranmor, students designed and fabricated a large-scale welcome installation for the Yuma civic center: a water tower and a patchwork car the students built from fabricated and vintage car parts.

Months after the unveiling, one of the students called her. He told her he’d been driving past “our sculpture” on his way somewhere he shouldn’t have been, and he turned around. Aranmor told him that any time he’s tempted to make a bad choice, he should go sit in front of that sculpture and think. The city paved a road in front of it and wired it with solar-powered headlights. “It’s a place you could go sit at and think about your life choices,” Aranmor says.

She’s also brought Weld Like a Girl workshops to domestic violence survivors and Special Olympians. When someone hesitates at the booth, Aranmor flips the script. “I can teach an 88-year-old,” she tells them. “Are you doubting me?” It shifts the weight off their insecurity and lets them lean on her confidence. The mood lightens and they pick up the torch.

Opening the Next Door

A Weld Like a Girl participant works metal at the shop. Aranmor’s students have fabricated welded pieces for display around the Yuma community.

In February 2026, Aranmor launched Welder Corps, a new program geared toward veterans and their families. She kept the pilot class small: five participants, ranging from an 11-year-old homeschooler to a retired Army veteran who decided, in his 80s, that he wanted to learn to weld.

Her program uses the National Center for Construction Education and Research (NCCER) curriculum, starting with a core class where participants can earn a wallet card certifying jobsite readiness. Participants can take all seven NCCER units or go piecemeal.

Her other group in pilot is Future Welding Inspectors where she teaches groups of 10- to 17-year-olds to identify good and bad welds using challenge cards and gamification. As a certified welding inspector, she wants the group to be a pipeline creating more certified welding inspectors. Her goal is to develop a full curriculum with interactive and digital components.

More Than Welding

Across all of Aranmor’s projects, Weld Like a Girl, Welder Corpsand Future Welding Inspectors, the common thread isn’t welding. Welding is the tool to build a wellness that comes when people believe they can do more than they thought. She uses metalwork to crack open that door: a new skill, a public sculpture, a credential or even just a single weld that didn’t seem possible the day before. What happens next is theirs to decide.

Her message is the same whether she’s working with a domestic violence survivor, a transitioning veteran or a second grader holding a welding torch for the first time. “People need to know that they’re enough,” she said. “They’re enough.”

See what your team can build when the busywork gets out of the way.

The most-repeated line about the construction industry is that it resists change. The people doing the work are telling a different story, if anyone will listen.

The foreman gets promoted on a Friday.

On Monday, someone from the office hands him a laptop. There’s software on it he’s heard of but never opened. A project manager mentions, in passing, that the drawings for the next data center job are already loaded. Somebody (he’s not sure who) will show him how to use it. Eventually. Right now everyone’s running two jobs behind schedule and there’s a design change that just came through on a fourth-floor mechanical room.

He nods, takes the laptop home, and by Wednesday he’s watching YouTube tutorials at 10 p.m., trying to figure out how a takeoff works before the shop starts fabricating on Monday.

This isn’t a story about a contractor who won’t adopt technology.

It’s a story about an industry that keeps insisting the problem is willingness while the people doing the work are just trying to find enough oxygen to breathe.

The most-repeated line in the industry

Every conference opens with it. Every consulting deck features it. Every LinkedIn think piece leans on it.

Construction is slow to adopt technology.

The line has data behind it. McKinsey’s 2024 update to its landmark construction productivity research found that global construction productivity grew just 0.4% annually from 2000 to 2022, compared to 2 percent for the total economy and 3% for manufacturing. Construction firms historically spent less than 1 percent of revenues on IT, less than a third of what automotive and aerospace spent. The gap is real. It isn’t going away on its own.

How the gap gets explained is where the industry has gotten lazy. Contractors are traditional. Culturally resistant. Slow to change. Get them to see the light and adoption will follow. Buy the software. Attend the demo. Read the case study.

That story doesn’t survive contact with what contractors say the moment nobody hands them a multiple-choice answer.

Read what they wrote

In January, 303 MEP contractors sat in a conference room in Austin and answered questions in real time on their phones. Alongside the multiple-choice items were open-ended prompts, space for contractors to say in their own words what was really breaking their business. Their answers became the MEP Innovation Report 2026.

Across 532 open-ended responses, zero contractors said the industry should slow down on technology. Not one argued the old way was better. Not one pushed back against innovation on principle.

What they wrote instead sounded like this:

  • “Rate of change. Too fast for users to adopt effectively.”
  • “Adoption is a pain point.”
  • “Success implementing Stratus in the shop. Obstacle: implementation in the field.”
  • “Acceleration in schedules while design is lagging behind.”

These aren’t the words of an industry that wants the world to stand still. They’re the words of an industry, rather, sprinting and being asked to sprint faster, with fewer experienced people, against tighter deadlines, on drawings that aren’t done yet.

Nobody in these responses is asking for less technology. They’re asking for enough air to use the technology they already bought.

This isn’t just a construction problem

BCG’s research on AI adoption offers what might be the cleanest formulation. Seventy percent of the value in any digital initiative comes from people and process. Twenty percent comes from technology and data. Ten percent comes from the algorithm itself, the thing everyone spends most of their time talking about. Seventy-four percent of the companies BCG surveyed had yet to show tangible value from their use of AI. The technology worked fine.

The most vivid proof came from an operating room. In 2009, a study in the New England Journal of Medicine introduced a 19-item surgical safety checklist into eight hospitals around the world. Major complications fell from 11% to 7%. Inpatient deaths fell from 1.5% to 0.8%, a drop of more than 40%. No new technology. No new equipment. Just a documented process that everyone in the room followed.

Construction hasn’t figured this out yet. MEP contracting is where the gap shows up the sharpest.

The number that should change the MEP conversation

Back to the 303 contractors in Austin.

Fifty-one percent said their documented business processes were not sufficient. Only 5% said they were fully documented.

Hold onto that 5% for a second.

Nineteen out of every 20 MEP contractors in the room, firms with full order books, sophisticated tools, leadership teams thinking seriously about VDC, BIM and AI, don’t have the documented workflows that would let a new hire, a new crew or a new tool plug into how the company ultimately works.

Before anyone dismisses this as a small-shop problem, look at the cross-tab. Among the smallest firms surveyed, those with fewer than 20 employees, 60% reported inadequate process documentation. Among the largest, firms with more than 1,000 employees, 46% said the same. A 15-person shop and a 1,500-person shop, dealing with the same problem. That shows up whether you’re doing takeoffs on a strip mall or a hyperscale data center.

Why the resistance story keeps getting told

Because it’s easy.

If contractors are the problem, the solution is more pitching; more demos; better case studies; and sharper ROI calculators. That playbook has been running for a decade. It hasn’t worked because it was solving the wrong problem.

There’s a name for what’s really happening. Change management research firm Prosci calls it “change saturation,” the point at which the volume of change an organization is being asked to absorb exceeds its capacity to absorb any of it. More than 73% of respondents in Prosci’s most recent research said their organizations were near, at or beyond that point.

A 2023 Harvard Business Review article put numbers on the collapse. Employee willingness to support enterprise change fell from 74% in 2016 to 43% in 2022. The average employee faced 10 planned enterprise changes in 2022. In 2016, it was two.

Contractors aren’t different from workers in any other industry. They’re just further along the same curve, dealing with all the same fatigue, plus a labor shortage, plus incomplete designs, plus schedules that were locked in before they walked in the door.

You can’t persuade your way past a calendar that’s already full. A great pitch to a contractor with no bandwidth to absorb it isn’t a missed sale. It’s a missed signal.

MEP is at the epicenter

Labor is thinning out. Designs land half-finished. Field teams adapt to information that isn’t ready, then absorb the rework when it changes. Supervisors stop planning because they’re too busy correcting. Every marked-up drawing that must be re-issued in the field, every clash resolved in real time, every RFI that sits open for another week — that’s a contractor spending capacity they don’t have on friction that shouldn’t exist.

The pressure is worse because the demand is enormous. Dodge Construction Network reported that commercial construction planning was up 37.2% year-over-year in April. Strip data centers out and the number drops to 5.8%. Meanwhile, AGC of America’s 2026 outlook found that 82% of firms are struggling to fill hourly craft positions, a higher share than at any point in the past three years.

Enormous demand. Compressed schedules. No bench to draw from. That’s the capacity trap.

What building capacity looks like

This is where the story turns.

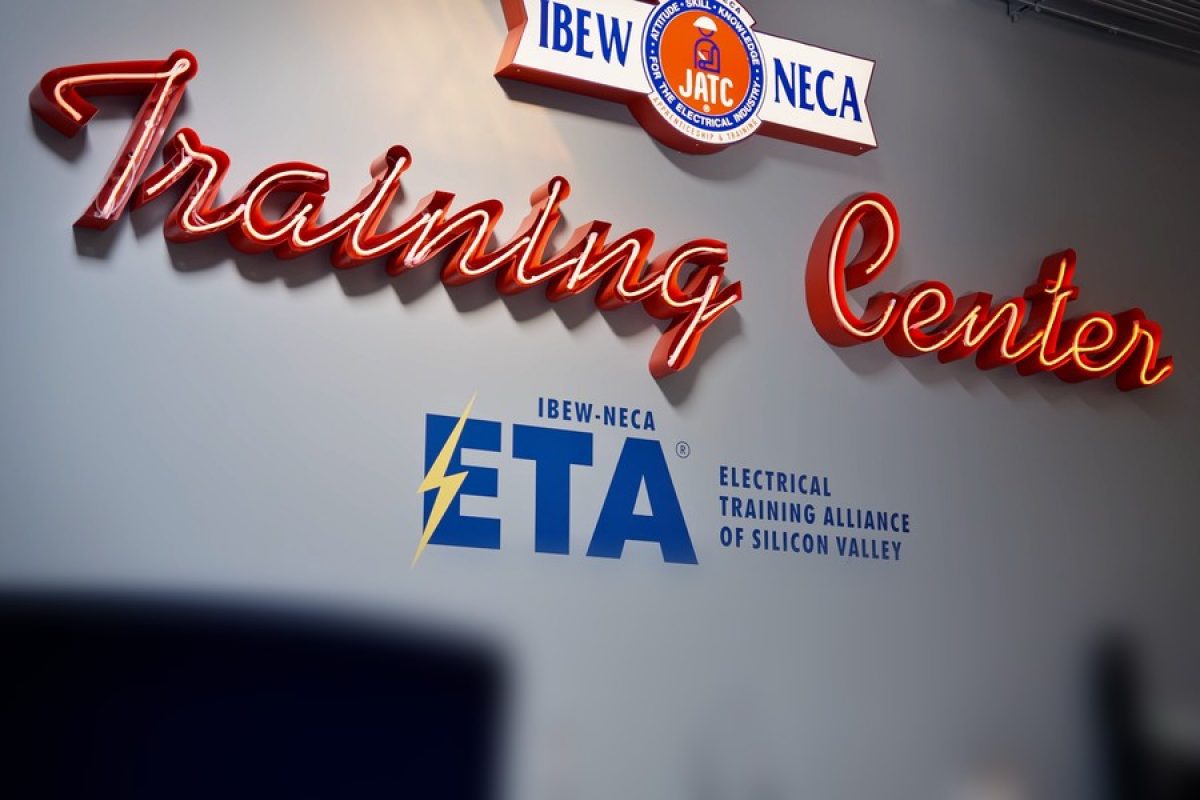
In Santa Clara County, California, the largest electrical apprenticeship program in Northern California is doing something transformative. The Electrical Training Alliance of Silicon Valley (ETASV), jointly managed by IBEW Local 332 and the NECA Santa Clara Valley chapter, trains an average of 600 students and has built two Bluebeam courses into its curriculum. One assumes zero prior software knowledge. The other hands students a working tool set built over years of real jobsite use and teaches them to design real projects with it.

Chris Paup, who built the fundamentals course and now serves as a business representative for IBEW Local 332, wrote most of it while deployed overseas with the California Air National Guard. Free hours between duty shifts, testing early lessons on the service members around him. When he got back and put 20 students in front of the material, he says the first thing he learned was how much he’d have to change.

The result: union electricians who show up on data center jobsites already digitally fluent. Not learning on the fly. Not being handed a laptop at 10 p.m. on a Wednesday. Ready.

“That’s when you see them showing up 45 minutes early, an hour early,” Paup says, describing the moment students stop learning the software and start bending it to their own problems. “Because they’ve been thinking all day about how they can do this and they can’t wait to get to the classroom to try it.”

The full story of what ETASV is doing is coming to BUILT soon. It’s worth reading in full, not just as an example of the capacity building this report keeps pointing to, but because it suggests where the industry’s answers might ultimately come from: the training centers, union halls and apprenticeship programs doing the work while everyone else argues about resistance.

The real work ahead

One more thing worth noting. The MEP Innovation Report found that only 17% of contractors describe AI as active in any workflow beyond pilots. The most common description of the industry’s relationship with AI, chosen by 20% of respondents, was “it’s complicated.” That’s not skepticism, just honesty. But the tools don’t care. AI-powered design review, automated markup, drawing comparison, natural-language workflow prompts are already shipping. Every one of the pressures above is now on a shorter clock than it was last year.

The MEP industry that shows up in this data isn’t stuck in the past. It’s ambitious, capable and increasingly well-equipped. What it doesn’t have is room — room to plan, to train, to implement the tools that could make the next 24 months easier instead of harder.

The firms that move fastest over the next two years won’t be the ones that buy the most software. Instead, they’ll be the ones that figure out how to create enough organizational stability, in enough parts of the business, for long enough, to let new ways of working take root.

That’s harder than buying tools. There’s no purchase order for protected planning time. There’s no vendor selling a Tuesday afternoon where nobody is firefighting. Those are the things that separate the firms that pull ahead from the firms that never quite catch up. At Bluebeam, we’re publishing this series because we think the industry is ready to have the harder conversation. The one about conditions, not tools.

The real work ahead is building the room to do it.

This is the first in a four-part BUILT series on the MEP Innovation Report 2026, produced in partnership with MCAA, NECA and SMACNA. Upcoming posts examine the growth paradox, the technology-to-process gap and what MEP contractors are saying about AI.

Your crew already has the tools. Give them the room.

The New York Times says America's infrastructure is stuck in permitting hell — and they're right. Yet they're missing half the story.

In January, a corroded section of the Potomac Interceptor sewer line burst in the Maryland suburbs of Washington, sending more than 240 million gallons of raw sewage toward the river — one of the largest such spills in U.S. history.

D.C. Water had wanted to reinforce that stretch of pipe for years, but the federal environmental review it needed dragged on well past a one-year deadline set in 2020, as a Washington Post investigation later documented. The pipe burst before the review was finished.

This spring, the New York Times Editorial Board used that story to make a case for permitting reform. The editors called for centralized oversight of transmission lines, binding timelines for environmental reviews and a congressional deal that speeds up infrastructure approvals without gutting environmental protections.

All good ideas. All politically hard.

All likely to take years.

Still, here’s what the Times missed: even if Congress passed permitting reform tomorrow, most public agencies would still be drowning.

Because the bottleneck is an operational problem that extends beyond what any regulation can accomplish.

I spent four years at the Office of Management and Budget watching federal agencies struggle with permitting timelines. Before that, I spent six years as an economist at the Bureau of Labor Statistics, building the data systems that agencies rely on to track what’s happening. I know what operational data looks like when it’s working and what it looks like when it isn’t.

At OMB, the delay was rarely the environmental analysis. Instead, it was version confusion, siloed reviews and comment reconciliation that nobody had ever properly resourced. That’s operational debt, and it accumulates quietly for years until a sewage line bursts. The good news is it doesn’t require an act of Congress to fix, just someone with the authority to look at the workflow honestly and decide that the status quo is no longer acceptable.

Federal environmental impact statements take an average of 3.8 years from start to finish. The Council on Environmental Quality’s own data shows that the gap between completing a final environmental review and issuing a decision averages 5.3 months — more than five times the 30-day regulatory minimum.

CEQ attributes that gap to “factors other than regulatory requirements.” In other words: administrative drag, not the environmental analysis itself.

We at Bluebeam work with hundreds of public agencies, and we’ve seen what happens when they stop doing the stupidest parts of their job. The results aren’t incremental.

Detroit went from issuing 3,000 permits a year to 7,500 — a 150% jump. Pleasanton, Calif., quadrupled per-reviewer capacity. Chicago’s Department of Transportation saved $24 million in 2022 by fixing utility coordination workflow.

What permitting looks like

Start in Las Vegas, 2018. The city handles more than 15,000 plan reviews a year. Before digital transformation, a customer walked in with two or three rolls of plans. A technician created a project number, manually stamped it on the plans and added a physical tag for tracking. Plans got checked into the system and stored in an “active” repository.

When a plans examiner was ready to review, they emailed the administrative staff with the plan number. The examiner physically walked to the repository. Staff retrieved the plans and logged them out. The examiner took the plans back to their desk, marked them up and returned them. Staff checked the plans back in, stored them again and waited for the next reviewer.

“Typically, we would have at least three to four different departments reviewing the plan and following this process,” Yolanda Palomo, process review coordinator for the city of Las Vegas, told Bluebeam.

That’s not 1985. That’s 2018.

Now zoom out. Seattle, same year. The city’s 430-person building department permits about $4 billion in construction annually.

Their review process didn’t use paper plans — but it wasn’t much better. Reviewers opened a submitted plan, then opened a separate text file to write corrections. Every comment went into that text file. When finished, an automated email sent the text file as an attachment. The applicant had to cross-reference the two documents to figure out what needed fixing.

It was siloed. Two digital documents that had to be manually reconciled. Version confusion was constant.

South Carolina, 2014. The state Department of Transportation launched a design-build team to accelerate infrastructure delivery. Yet their review workflow was killing that speed advantage. Reviewers submitted individual comments on separate forms sent via email. No centralized markup. No way to see what other reviewers had said.

“It was essentially like a relay race, where the baton is passed from the designer to the contractor,” Brooks Bickley, assistant program manager with the South Carolina Department of Transportation, told Bluebeam.

Where the time goes

When the Council on Environmental Quality publishes data showing environmental reviews averaging 4.5 years between 2010 and 2018, what does that time consist of?

A lot of it isn’t analysis, so much as coordination. CEQ’s own E-NEPA Report to Congress lays this out: agencies maintain “isolated, non-interoperable software systems.” Applicants submit the same data to multiple agencies. There are no common data standards; the public uses multiple platforms to track a single project.

Translation: agencies are spending months reconciling comments from different reviewers, chasing down the person who has the one marked-up copy, restarting review cycles because someone was working off version 2.3 when version 2.5 was current.

An Oregon Department of Transportation study of 12 highway projects found the strongest statistical correlation wasn’t between project complexity and timeline, but between the number of comment letters from state and federal agencies and the time to get from draft to final review.

More agencies commenting meant more time reconciling conflicting feedback, not necessarily more time analyzing environmental impacts.

A Federal Highway Administration survey of 89 long environmental reviews found the top delay drivers were lack of funding (18%), local controversy (16%), low priority (15%) and complex projects (13%).

Staffing and communication problems showed up in 42% of projects. These are workflow problems.

North Carolina saw this firsthand. Before implementing electronic plan review, the state’s multi-discipline reviews took weeks. After digitizing, North Carolina measured a 39% increase in productivity, not because they hired more staff or cut corners on compliance, but because they stopped losing time to coordination friction.

Las Vegas saw the same thing. Under the old paper system, plans could only be reviewed one discipline at a time — a week or more per discipline, across at least five departments. Printed mylars then had to be routed to five utility companies for final signatures, a process that took up to six weeks.

Then COVID hit.

The fix nobody’s talking about

March 2020. Every public agency in the country goes remote overnight. In most places, that would have been a disaster. Las Vegas, however, like the culture of the city itself, didn’t miss a beat.

“From my perspective, I don’t think we had any downtime due to COVID-19, other than the time that we waited to get laptops,” one city official told Bluebeam at the time.

Zero downtime, during a pandemic, for a department handling more than 15,000 plan reviews a year.

The city had replaced paper plans with digital files. Sequential review with concurrent review — multiple disciplines marking up the same plan at the same time. Physical repositories with cloud storage. Email attachments with real-time collaboration.

The regulatory requirements didn’t change. Las Vegas was still doing plan review, still checking compliance, still coordinating across departments. They just stopped doing it stupidly.

The results: eight-step paper process cut to four steps; $600,000 saved annually; reviews that used to take weeks now take days.

South Carolina cut design review time by 50%.

Detroit’s Buildings, Safety Engineering and Environmental Department went from issuing 3,000 permits a year to 7,500, supporting roughly $5 billion in development in 2023. Chief Building Official James Foster told Government Technology: “I can’t imagine how we would have been able to handle all of this if plan review were still on paper.”

Pleasanton’s Building Division saw per-reviewer plan checks go from 25 to 30 per month to roughly 100, nearly quadrupling capacity. Chief Building Official Robert Queirolo: “A plan check that might have taken six hours the old-fashioned way now takes a few hours.”

Chicago’s Department of Transportation implemented better utility coordination workflow and saved $24 million in 2022. They cut underground utility hits from the national average of 1.67 per 1,000 to 0.49.

Seattle ditched the separate text-file approach and moved to inline markup. In the first six months of 2022, the city approved 20% more complex construction permits than the previous six months. “The quality of communications was so high in our new system that we’re doing more volume — we are getting to ‘approved’ faster,” one city official told Bluebeam at the time.

What this means for infrastructure

The TransWest Express transmission line took 18 years to win final approval — not because anybody opposed clean energy, but because coordinating across jurisdictions, agencies and landowners is a nightmare.

That’s the same workflow problem Las Vegas had. The same coordination friction South Carolina faced. The same version confusion Seattle dealt with.

Policy reform matters. The SPEED Act, which passed the House in December 2025 and now sits before the Senate Environment and Public Works Committee, would streamline NEPA timelines and limit litigation windows. That would help.

But if your review process is still running on email attachments and paper round-trips, all the policy reform in the world won’t save you. You’ll just be doing bad workflow faster.

The emergency repair on the Potomac line is done and the water has cleared, but the cleanup has already run past its $20 million estimate — and the permanent fix still has to clear another round of environmental review, the same process that was too slow the first time.

Maybe Congress passes the SPEED Act. Maybe lawmakers broker a bipartisan deal. Maybe they don’t.

Yet while we wait, there are cities approving permits twice as fast because they stopped mailing PDFs and started marking them up in real time.

There are state departments of transportation cutting review cycles in half because reviewers can finally see each other’s comments.

There are public agencies that didn’t lose a single day during COVID because their workflow wasn’t dependent on paper.

It’s not sexy, and it won’t make the editorial page of the New York Times. But it’s the kind of infrastructure fix that doesn’t require a bill — just a willingness to look at how you’re really spending your time and admit that some of it is waste.

The permitting crisis is real. The Times is right about that.

But the fix isn’t just in Washington. Some of it is sitting in your own workflow, waiting for someone to finally admit it’s broken.

Parth Tikiwala is head of government affairs at Bluebeam and head of global public sector for the Nemetschek Group. He previously served as acting director of technology modernization and data at the U.S. Office of Management and Budget, Executive Office of the President.

Your agency’s biggest delay might be fixable right now.